There sure is a lot you can get for free on the internet.
Whether you've just started your investment journey, or been in the market for years, it's helpful to have a good idea of what it is your investments are doing.
And that's why you use some sort of portfolio tracker.
But do you go for a simple spreadsheet like Google Sheets or Excel?
Or do you fork out some money and pay for a slick-looking tool like Sharesight?
Each has its own pros and cons depending on how focused an investor you are.
That's why I've put together this article. To give you an idea of how each does the same tasks you'd likely want to perform when you are tracking your portfolio.
Introducing the best free stock tracking spreadsheet and Sharesight.
I've been a user of Sharesight for years, and before that I was a spreadsheet man.
Sharesight is a share tracking platform that gives you a place to aggregate all your investments and track their performance. It automates a lot of your portfolio management so you can see what you really are earning, well dividends come in and how to handle tax.
There is a free subscriber option which has limited features, but enough to have a decent go of tracking some investments. Personally, I have a premium plan and appreciate the value it provides in simplifying how I access portfolio performance.
A portfolio tracking spreadsheet on the other hand is a file using Excel of Google Sheets that is built to track the performance of your investment portfolio.
When you have a spreadsheet build for tracking investments, you have rules, formulas and nowadays pull in financial data to create a semi-automated approach to track your portfolio/
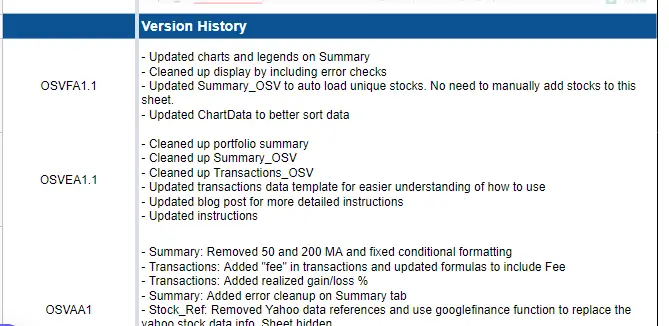
In this article I'm going to compare Sharesight with a spreadsheet. The specific spreadsheet I'll be using is the one that was most popular on Google, titled the “Best Free Stock Trading Spreadsheet”. You can find it here – The Best Free Stock Tracking Spreadsheet for Google Sheets (oldschoolvalue.com).
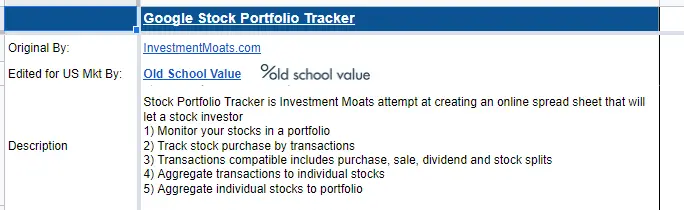
Now I'm not sure how you determine what's best, but it was free, easily available and does many of the most common features you'd want when tracking a portfolio.
I've spent a few hours on the spreadsheet while I've been a Sharesight user for a few years. Yes, there may be some bias in what I use and prefer but will aim to be objective in what both can and can't do.
Spreadsheet vs Sharesight: Pricing
You don't need to pay anything to use a spreadsheet or Sharesight to start tracking your portfolio.
Using a spreadsheet like Google Sheets to track your portfolio is completely free. You do need a Google account to create and manage them.
If you wanted a more robust spreadsheet tool, then Excel is for you. Excel might already on your computer otherwise you will need an Office 365 account to download and use.
Sharesight has a forever free plan. This does have limitation but for many investors, especially those just beginning this is likely to cover what you need.
The Sharesight free tool allows you to add up to 10 holdings such as your stocks, shares, ETFs. There are some reporting features available, and you will find most helpful features available to use.
You will see a lot of promotion to upgrade to a premium plan as you use it, so that might get in the way but you can easily upgrade if you do wish.
Should you want to move to a premium plan for Sharesight, then there are a few tiers that you can work up. They open up more reporting, allow more holdings to be added (including cash accounts) and benchmarking of your portfolio.
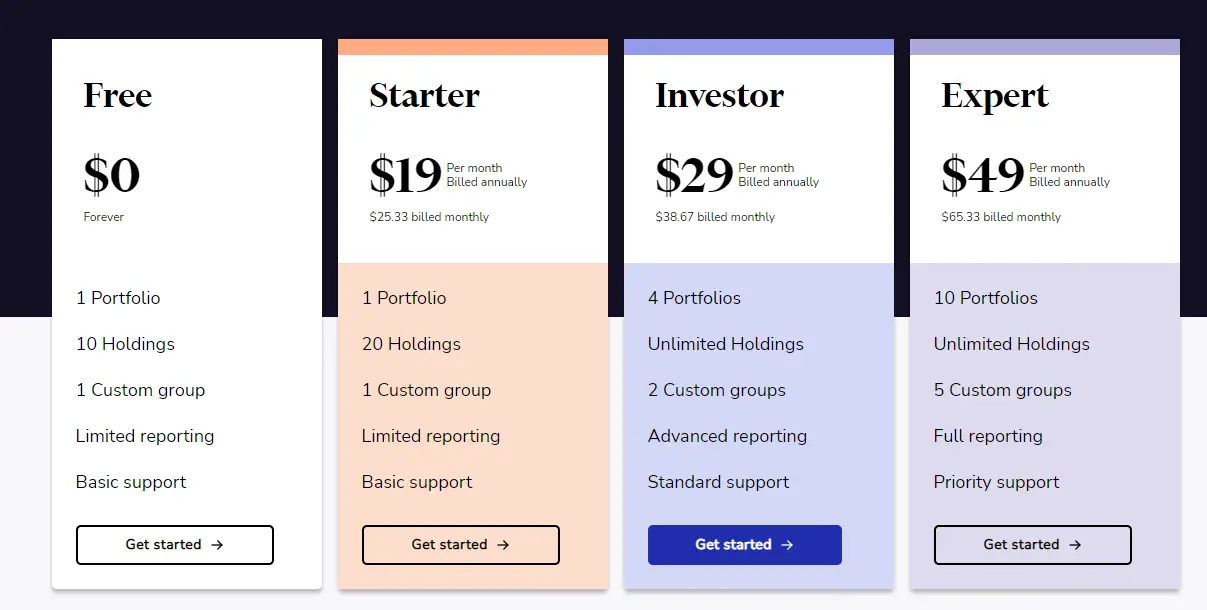
Depending on your location, pricing can range from $19 a month to $49 a month (billed annually). There may also be an opportunity for you to claim the cost on your tax return as it will be able to help you manage your tax affairs.
The Best Possible DEAL On Sharesight Right Now
I've done the work and found that you can currently save 4 months on any new annual premium plan (I wish I got this but it's for new users only). You can start for free, upgrade later, and still get the deal.
Spreadsheet vs Sharesight: Features
When we compare features, it's worth noting the difference in the two tools.
A spreadsheet is a blank canvas, you can build and create as many features as you want.
Sharesight has a team working on a specific product that is built and developed by the group.
With Google Sheets you can:
- Customise as much as you like
- Pull data from Google Finance to find a share price
- Create charts, and graphs the way you want to see them
- Enter any type of formula or equation to produce a result
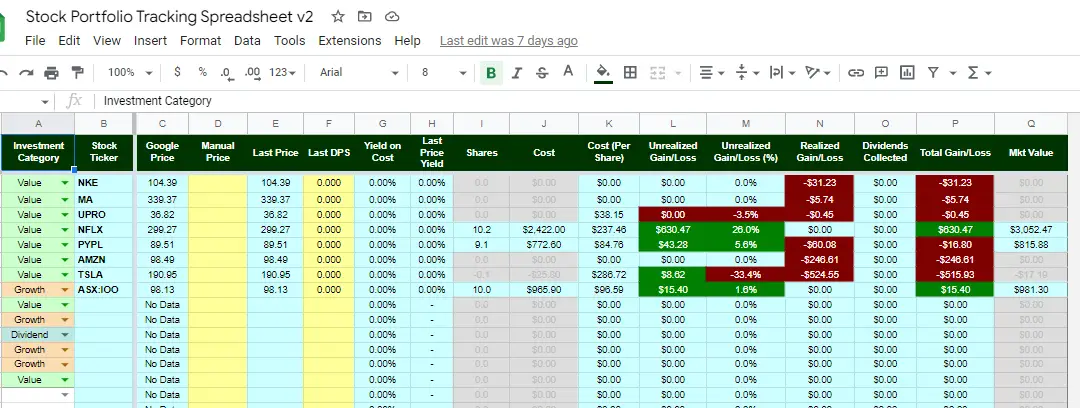
In terms of portfolio management and the spreadsheet template that I was using, I could:
- Enter transactions such as when I bought and sold shares
- View my current holdings
- View performance over time
On top of those last points Sharesight also has the ability to:
- Report on CGT – to help fill out your trades in your tax return
- Benchmarking – compare the performance of a stock against your portfolio
- More reporting options and visuals to understand your performance or diversity
- Automatic transfer from brokers – so you don't need to enter transactions manually
- A private active community forum for members
- Ability to group and categorise your investments
- The share checker that gives you historical performance and true return numbers of any stock
While Sharesight easily has more features for the template I was comparing with, remember that with a spreadsheet you can build it up as much as you like. The counterpoint is that you will be hands-on if you do this and Sharesight already has 85%+ of the features you'd likely need as an investor.
Spreadsheet vs Sharesight: Your holistic view of portfolio
In a spreadsheet, you will either need to build a visual summary or accept the one provided in the template you might use.
This can of course be built and added to, but you need to find what you want to see and work on the formulas to build that.
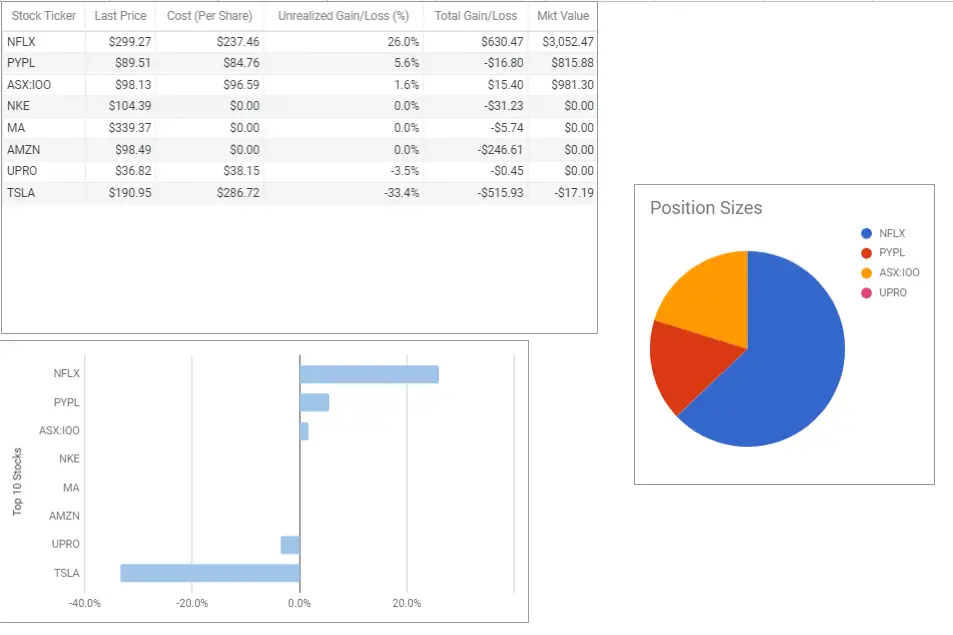
The template I was using had a nice simple summary of all the holdings I had and a chart to demonstrate the breakdown of them all. This was kept in a separate tab to the data I was entering for transactions.
Spreadsheet on the other hand gives you a dashboard that presents the total return of your portfolio. This is broken down into the growth, the dividends and currency gains then combine to provide your overall return.
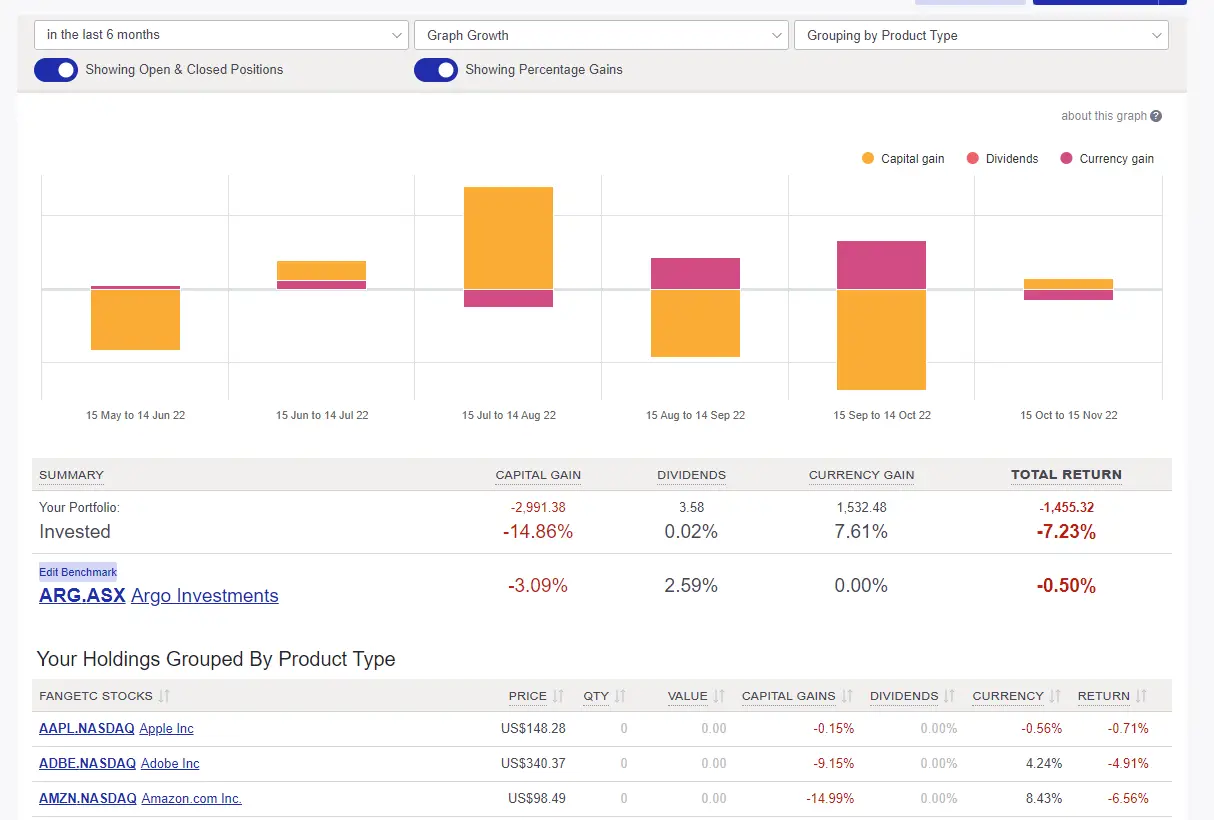
As you scroll down the dashboard you can see the performance of your individual holdings.
Another benefit of Sharesight is that you can easily change the date range. From days, to weeks, to years. Doing this in a spreadsheet would take a bit of work, maybe a pivot table and then you need to confirm the data is accurate.
Spreadsheet vs Sharesight: Reporting and visuals (including dividends and stock splits)
If you are interested in looking beyond a high-level summary of your portfolio, then Sharesight might be for you.
While a spreadsheet is capable of being customised and built to your requirements, you are limited by your imagination.
Sharesight collects feedback and data from its users to understand what is in demand and is helpful when tracking investments.
So, while there is a dashboard page, much like you'll see in any spreadsheet. Sharesight offers more. And being a premium product, it should.
Each holding you have had its own page. This includes a summary of its performance over time, basic transaction data, and also dividend or stock split information.
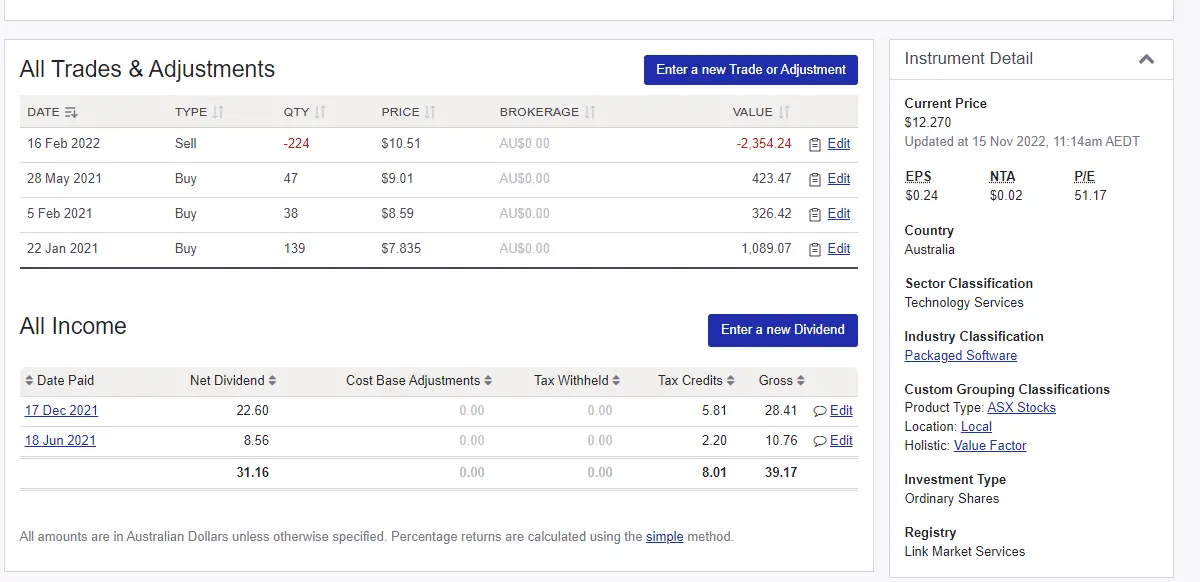
The connectivity Sharesight has means that market data feeds in in real time. You will immediately have information on dividends or stock splits populated on your holding page when it is announced. This gives you an indication of when to expect a dividend or the stock to split.
It's going to be hard to match this in a spreadsheet, at least before the event like a dividend payout happens. You can retrospectively add dividends from the spreadsheet template I was using but that is a manual process.
Another feature available is the charts and various reports available. These are mostly available to paid Sharesight members.
You can quickly load charts from any point of time. Here is what my portfolio looked like in January 2019
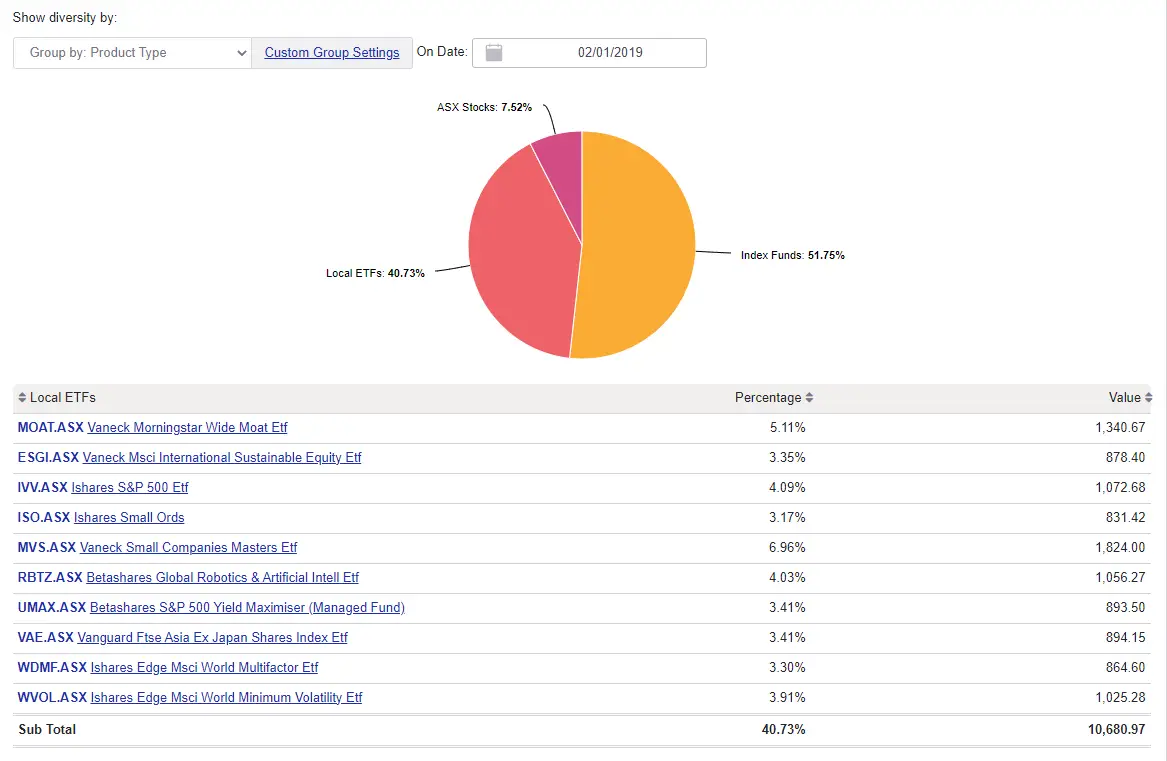
Other options include a summary report on any future income coming in, a contribution analysis of how each individual holding has contributed to your returns (example below) and even a list of all the CGT events you performed over any given period.

These types of charts can all be built in a spreadsheet like Google Sheets, but again you need to know how to build and connect data. With Sharesight its already done.
Spreadsheet vs Sharesight: Ease of use
Sharesight is built to make it easier to manage than a spreadsheet and it shows. BUT a spreadsheet can be built and customised any way you like to be as easy to use as possible.
The answer to how easy either is dependent on your ability. If you are a spread sheeter and know excel, then you can find it easy to work a stock tracking spreadsheet. If you prefer the plug-and-play approach, then it might be that Sharesight is the easiest.
For Google Sheets, having connectivity with Google finance is a bit plus. You can automate the collection of data so that your spreadhseet updates without your input. IT can then do a few more calculations to provide an automated summary for you. Easy.
Sharesight does this anyway due to the team doing all the building for you.
Both can be automated to make things easy, but Sharesight will do that for you and for a spreadsheets its mostly DIY (unless you find someone else's template and like it).
One aspect that you could say is a negative to managing a spreadsheet is the exposure to all the data.
At any time, you can press a wrong key or cell and break a formula. I did this a couple of times as I was preparing my tracking spreadsheet, which means you need to back track or problem solve to fix.
Spreadsheets can get bit fiddly so you will need some skill in managing the file and its data. With Sharesight you pay someone to do that for you.
Once the learning curve of both tools are completed though and you find a rhythm they can be fairly simple to update and track. It depends on what information you need to see and in what way.
The Best Possible DEAL On Sharesight Right Now
I've done the work and found that you can currently save 4 months on any new annual premium plan (I wish I got this but its for new users only). You can start for free, upgrade later and still get the deal.
Spreadsheet vs Sharesight: Longevity and support
The question I'm asking here is – Can your tracker scale as your portfolio grows? And who will help you?
While your spreadsheet template might look great on day 1. Is it going to hold up over time?
And if it needs to change, due to you investing in different currencies, equities or markets then how will your tracker handle that?
Sharesight is built to manage investors across the world, dealing with different currencies, time zones, and options. It has added support for cryptocurrencies and adds connectivity with brokers as they emerge.
The evolution of the tool is continuous. A spreadsheet on the other hand is static. You need to be the one to update it and assess its abilities.
Support is also something to compare between Google Sheets and Sharesight.
When you are using a spreadsheet the support it gets is basically you. You need to either upskill yourself in the equation work or find someone who can help. Sharesight has a team available to answer your questions, and help you set up and track what you need.
There is also a health community of similar-minded investors in the private forums of Sharesight. So, while you are getting the platform included in the price, there is also the private community that I find is a great improvement to the free advice you get on the internet.
Spreadsheet vs Sharesight: Which one is better
You might feel like became a bit biased towards Sharesight as the article progresses. This wasn't to advertises, but really elevate the fact that the platforms are really different in what they offer. Like I said, a spreadsheet is a canvas you need to paint. It won't track a portfolio by default. Sharesight is like a fancy version of a ever evolving spreadsheet, without the formulas in view.
So which do you pick? The good news is that you don't need to pick one and stick with it forever. You can find what works for you and stay there. For me I went from spreadsheet to free Sharesight plan to Expert plan member. It made sense for me due to the number of holdings I have, the currencies I trade in and my general interest in investing.
Choose a spreadsheet (like this one) if:
- It's early days in your investing journey
- Your investing is simple – a very few numbers of stocks or ETFs
- You invest in one currency only
- You are good with spreadshets and numbers
- You like creating and building things
Choose Sharesight if:
- You want to set and forget portfolio tracking
- You love quick, sharp looking metrics and charts of portfolio performance
- You enjoy connection with a community of likeminded people
- Tax time is time consuming due to CGT event
- You want to automate as much as possible
- Support is important
The Best Possible DEAL On Sharesight Right Now
I've done the work and found that you can currently save 4 months on any new annual premium plan (I wish I got this but its for new users only). You can start for free, upgrade later and still get the deal.